Platform · The method
How the questions we measure are born
Every AI visibility tool measures answers. The difference is in the questions: who writes them, how they are phrased, and by what criterion you decide that set represents a market. It is the only axis where we compete on merit.
In short
BIKMA does not rewrite keywords as questions. It builds the prompt set from the scientific literature on information behaviour and on the behaviour of generative models, samples every intent with several phrasings, and weights each question with a statistical inference model validated with the University of Pisa. What comes out is a declared probability, not an observed volume.
If the set of questions is arbitrary, every number built on top of it is arbitrary. That is why we publish the criterion by which the questions are born, and the evidence it rests on.
What sets us apart from the other tools
The first point is where the questions come from. Some tools start from Google search data and present it as conversations with AI: it is not the same thing. Others use panels of observed users, which work well but exist almost only in English and in the largest markets: outside those, in other languages, in B2B and in vertical niches, coverage drops to zero. BIKMA reconstructs the questions from the way people actually talk online, with a published method. It is an estimate, and we say so openly, but it covers precisely what no panel sees.
The second point is how the set is built. Several versions of the same question instead of one, brand questions kept separate from category ones, questions written in the language of the market rather than translated from an English set, comparisons at equal specifications so the best-known brand is not rewarded by default, and for small brands a different indicator: not how often they appear on average, but whether they manage to appear at all on some kind of question. Every choice comes from a published study, not from a preference of ours.
The third point is that all of it is verifiable. We publish how we build the set, how we compute the metric and where it is wrong. The method was validated with the University of Pisa and cited at The Web Conference. Anyone who talks about a «proprietary model» without showing it is asking for your trust; we are asking you to read the method.
How you ask matters more than how often you ask
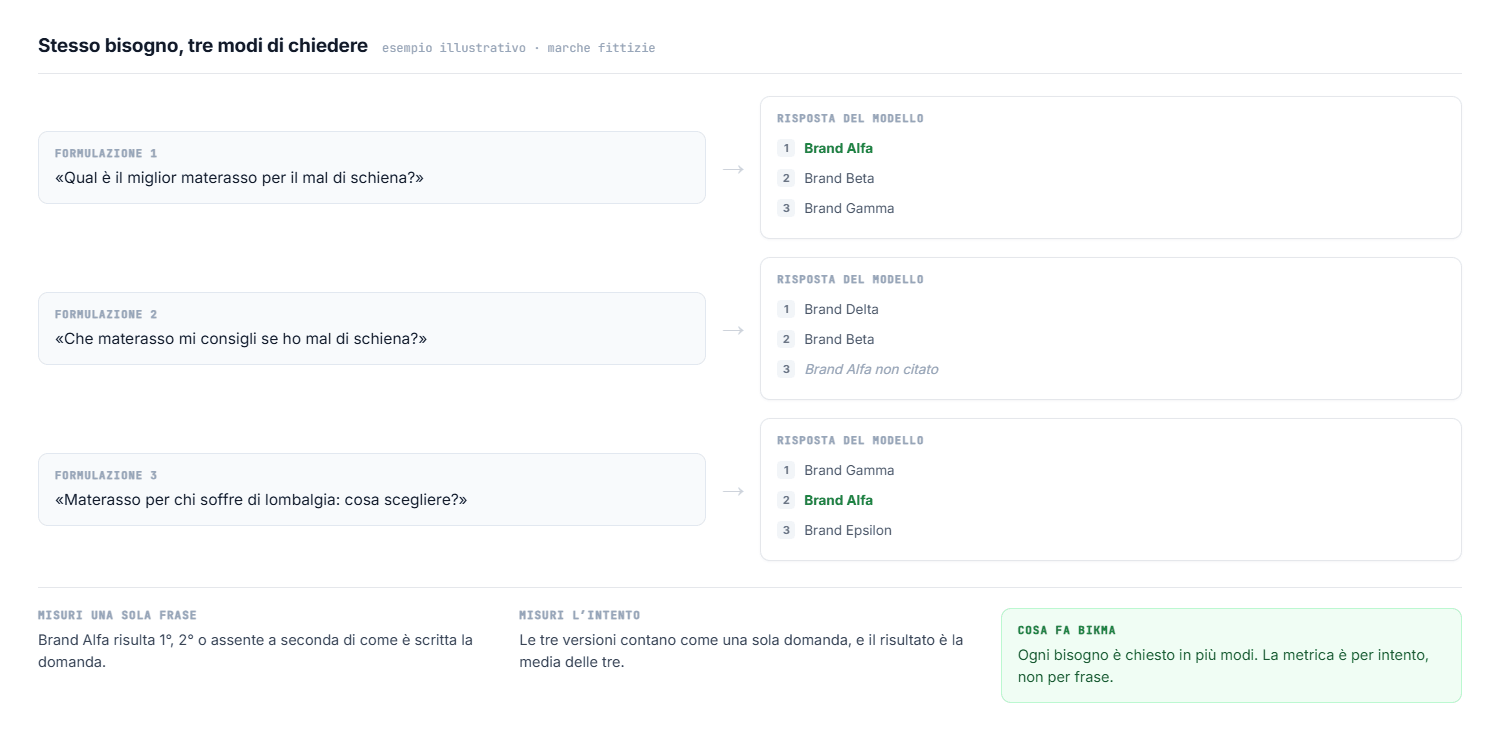
The most common objection to AI visibility tools is that models give different answers every time. That is only partly true. Research shows the answer changes far more when you rephrase the question in other words than when you repeat the very same question twice. In practice: “what is the best mattress for back pain” and “which mattress would you recommend if I have back pain” can return different brands, even though they ask the same thing.
The consequence is simple. If you measure a market with a single version of each question, you are not measuring the market: you are measuring that sentence. This is why BIKMA uses several versions of the same question and aggregates the result by intent, not by individual sentence. How the questions are born is not a technical detail: it is the measurement itself.
What the science says
The evidence that guides the design of the prompt set. Peer-reviewed where indicated, preprints verified on arXiv for the key findings.
| Evidence | Study | What it implies for measurement |
|---|---|---|
| The effectiveness of visibility levers varies by query category: direct quotations +27.8%, statistics +25.9%, keyword stuffing −17.8% across 10,000 queries | GEO: Aggarwal et al., KDD 2024 (peer-reviewed, arXiv:2311.09735) | The set must be sampled by demand cluster: an average across the whole market hides opposite effects |
| Recognition and discovery are different phenomena: ChatGPT recognises 99.4% of startups when named, but surfaces them in only 3.32% of discovery queries | Discovery Gap (preprint, arXiv:2601.00912) | Branded and non-branded prompts must be measured separately, not summed into a single visibility index |
| Querying in the language of the market raises recommendation share by +0.80 for local champions, against +0.15 for multinationals (35,640 answers, 12 European languages) | Language Blind Spot (preprint, arXiv:2606.23165) | An audit run in English systematically underestimates local brands: native prompts in each language are a methodological necessity |
| LLMs associate global brands with positive attributes and marginalise local ones; at identical specifications the well-known brand wins 100% of the time | «Global is Good, Local is Bad», EMNLP 2024 (peer-reviewed, arXiv:2406.13997); Incumbent Advantage (arXiv:2606.17443) | You need prompts «at equal specifications» and with qualitative constraints, otherwise you are measuring prior fame |
| Visibility is bimodal: tier 1–2 brands almost always surface, while 48–52% of tier 4–5 never do (37,000 runs) | Reachability (preprint, arXiv:2605.27439) | For long-tail brands the useful KPI is reachability (surfacing on at least one prompt family), not average frequency |
| Agreement between models on the most-cited brand is 41.6%; in 8% of queries no brand dominates | Cross-model disagreement (preprint, arXiv:2606.23057) | Multi-model monitoring is not redundancy: it is the only way to find the empty spaces |
| Generative engines systematically favour third-party sources over brand-owned content | Earned-media bias (preprint, arXiv:2509.08919) | Cited sources must be measured as a dimension of their own: your own site is not the main lever |
| Human consideration sets in consumer goods hold 2–4 brands | Hauser & Wernerfelt, JCR 1990 (peer-reviewed) | An answer listing five brands has already saturated the mental set: position matters more than presence |
| Priming changes the choice without changing the evaluation of the brand | Nedungadi, JCR 1990 (peer-reviewed) | Being cited ≠ being preferred: mention and sentiment must be measured separately |
| Usage context restructures the mental category and recall (goal-derived categories) | Barsalou; Ratneshwar & Shocker, JMR 1991 (peer-reviewed) | Occasion-related prompts query different brand sets than category ones: they are an axis of their own |
| AI recommendations are preferred on utilitarian attributes and rejected on hedonic ones | Word-of-Machine: Longoni & Cian, Journal of Marketing 2022 (peer-reviewed) | Calibrate expectations: generative recommendation weighs more in utilitarian verticals |
| Traffic below 0.2% of the total, but a 4.6x effect on high-complexity products (973 sites, 50k transactions) | Kaiser & Schulze, Marketing Science 2026 (peer-reviewed) | The value of monitoring concentrates on complex categories, not on session volume |
How it translates into our prompt set
-
01 · Theoretical base
The literature on information behaviour in the sector defines the demand families: category, usage occasion, comparison, budget constraint, reassurance.
-
02 · Real public conversation
Forums, communities, reviews and social provide the actual expressions the market uses for those needs. No keyword rewritten as a question.
-
03 · Multi-phrasing per intent
Every intent is sampled with several variants, including constrained and persona versions, and the metric is aggregated on the intent.
-
04 · Weighting and clusters
The Prompt Probability Index assigns each question its estimated probability in that market and period, with a declared margin of error.
Frequently asked questions
Taken verbatim from the monitored prompts. FAQPage schema.
Why not use a panel of real conversations?
Because no panel covers demand in Italian, in narrow B2B verticals and in small markets. Where a panel observes, observed data is better; where it does not, the alternative is not worse data, it is no data.
How many prompts does a market need?
It depends on breadth: typically 60–120 well-chosen prompts cover a B2B vertical, many more a consumer market. What counts is coverage of the demand families, not the absolute number.
Are the cited papers all peer-reviewed?
No, and we say so: work in this domain is largely recent and still in preprint. The table distinguishes the two conditions, and the key findings from preprints are verified on arXiv.
Can I add questions of my own?
Yes. The set is editable and every manually added question stays marked as such, so it does not contaminate the historical series.
How the method works
-
How we identify the questions
The measurement scope is not pulled out of a keyword research tool: it is built.
-
The Prompt Probability Index
A metric with a proper name, a formal definition and a declared scale.
-
Where the signal comes from
Real public discourse is the model's input. These are the source classes we use.
-
Scientific validation
Eight years of research collaboration, a paper cited at The Web Conference, more than 200 enterprise projects.
-
Limitations and margin of error
Nobody in this category publishes the limitations of their own method. This page exists for that reason.
Try it on your own data
Start the 7-day free trial yourself (card required, no call needed): see your real data before choosing a plan.